Introduction
We become what we behold. We shape our tools and then our tools shape us. - Marshall McLuhan
Many IDEs and editors include features to support developers in their day-to-day coding. This is part of what makes them so great: it’s a huge time saver when you don’t have to open a browser or switch to the terminal every time you want to run a quick test, check the status of an issue tracker, or view some documentation. That said, there are a lot of convenient tasks and useful information that cannot be found in the IDE.
This is due to the fact that there are no single correct representations of anything in software. Software is moldable and is meant to be shaped to fulfill specific purposes. Just because multiple companies share similar concepts does not mean they would benefit from representing those concepts in the same way. How any individual company defines a “Customer” is very unlikely to be exactly the same way any other company defines a “Customer”. Even how individual companies define “Customer” is unlikely to be perfectly consistent throughout their own codebase.
This is why to truly evolve how we as developers create software, having the ability to personalize our tools (i.e. IDEs) to better fit our software’s unique shape would be a game changer. Instead of constantly switching between peripheral software abstractions, we could create a single, unified representation designed to perfectly match the software we built it around. This is the vision behind our latest feature: Live Commands.
Live Commands
Live Commands offer the ability for developers to programmatically add custom functionality to their IDE with very little effort. Including custom keyboard shortcuts, actions, dialogs, notifications, inlays, and more. Thereby giving developers a powerful way to tailor their IDE to the specific needs of their team and personal preferences.
To see how simple it is to extend our IDE with Live Commands, let’s implement some simple use cases.
boot-time
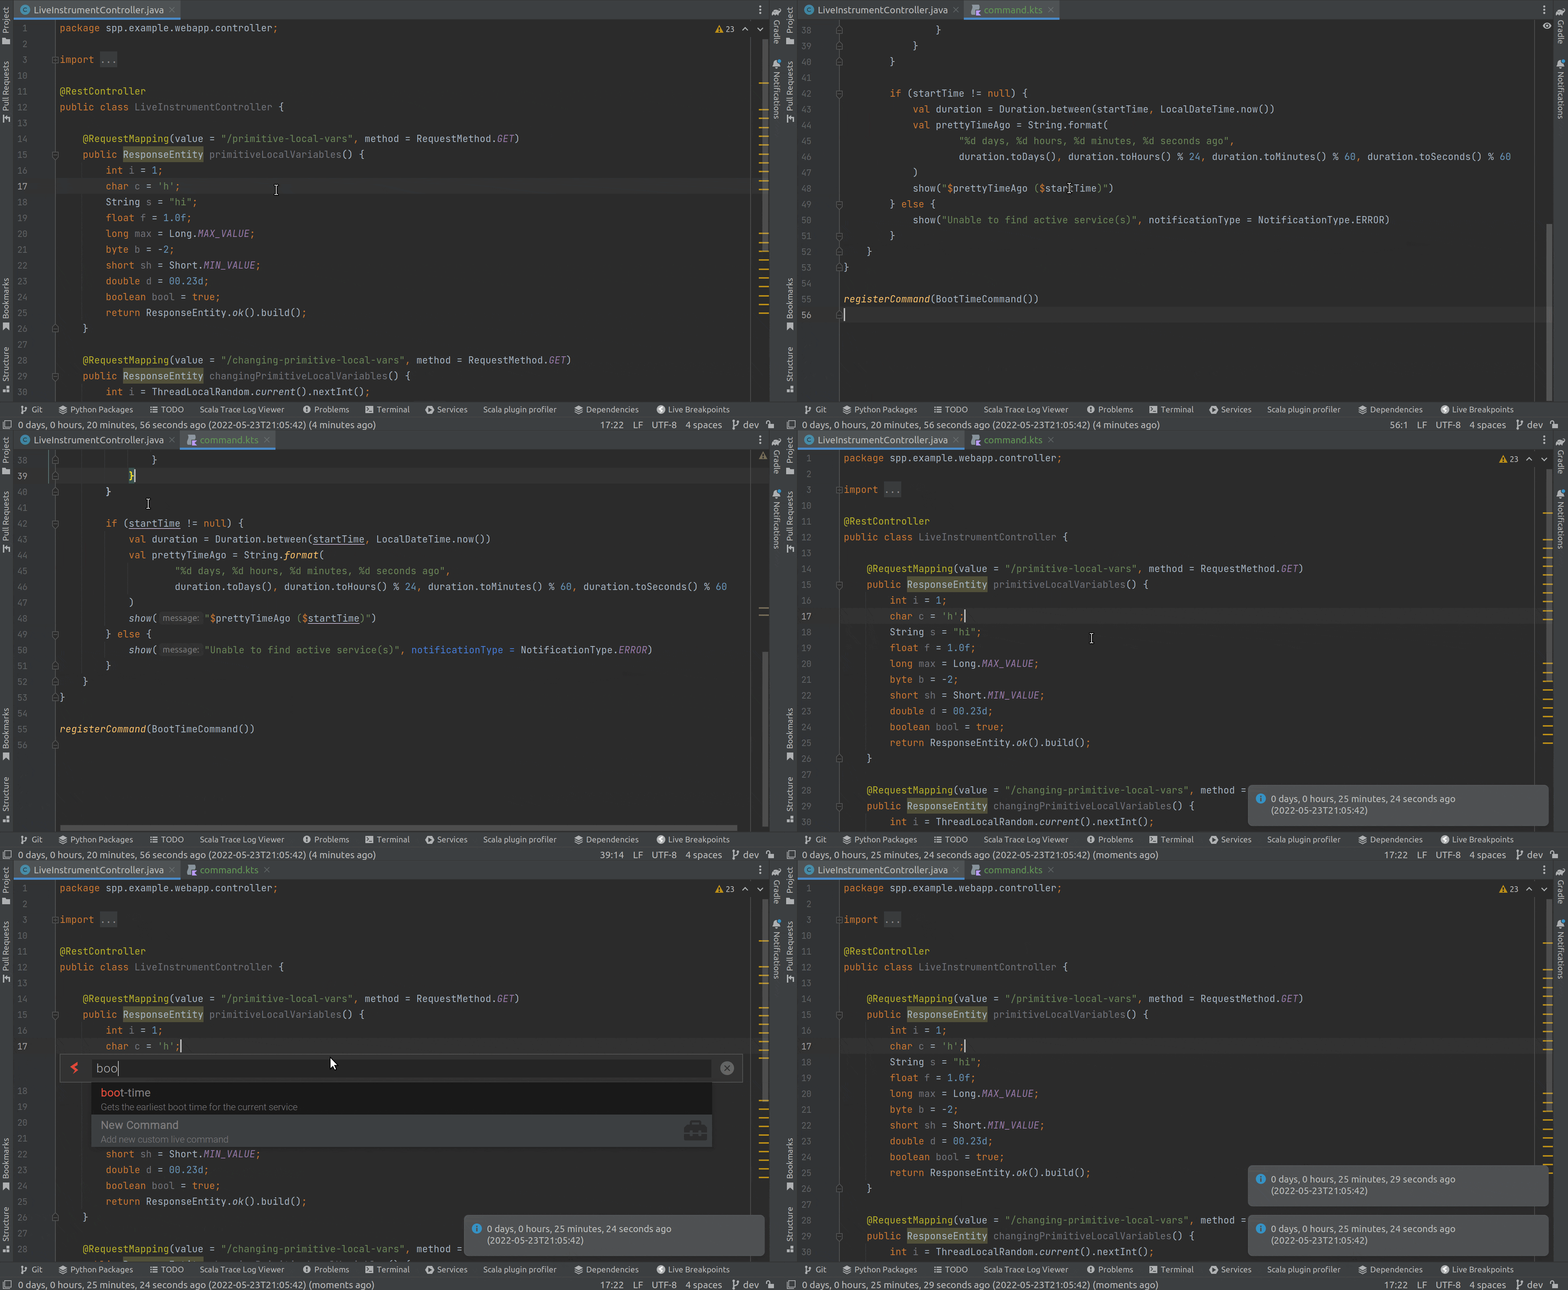
To start with, let’s say we have a web application, and we’re curious how long it’s been actively running in production. Normally this would involve looking at server logs, querying a database, finding the necessary APM dashboard, or some other external source. Instead, using Live Commands, we can create an internal command, keyboard shortcut, notification, or even persistent hint with this information displayed directly inside our IDE. For this example, we will go with a simple popup notification.
To create a Live Command, we will first need to install and configure the Source++ Plugin. Once installed, we can create Live Commands by bringing up the Live Command Palette via keyboard shortcut (Ctrl+Shift+S), choosing “New Command”, and inputting the desired command name. In this case, it’s boot-time.
 Creating new Live Commands is simple! If only we could make naming things so easy...
Once we’ve chosen our command name and hit enter, we are taken to the new file .spp/boot-time/command.kts. This is where we can define exactly how our command works, add additional resources, and finally commit our new command for other developers to use once we’re finished. To get us started, whenever we create a new command, Source++ will automatically create a Hello World template for us:
We could run this command now by right-clicking anywhere in this file and selecting Load ‘boot-time’ Command. This will make our new command available to us inside the Live Command Palette. We could then select our new command, and it would display a simple notification with the text “Hello World”. That would be neat, but it’s not quite what we’re looking for. We’re interested in knowing how long our application has been running in production.
To get how long our application has been running in production, we’re going to need to get a bit of information from Apache SkyWalking, the application performance monitoring tool Source++ is built on. Luckily, Live Commands are automatically aware of the environment they are running in, and will automatically connect to available services. This means we can simply call one of the available services (e.g. SkywalkingMonitorService) whenever we need it.
Conveniently, SkyWalking’s Java agent reports the VM’s start time in an instance attribute called Start Time. We can use this to calculate how long our application has been running in production. So let’s write a bit of code to do this:
Putting this all together, we now have a simple way of quickly determining how long our application has been running in production. Better yet, we can even commit our new command and share it with the whole team!
 Add, configure, install, and use the new boot-time command in real-time
library-check
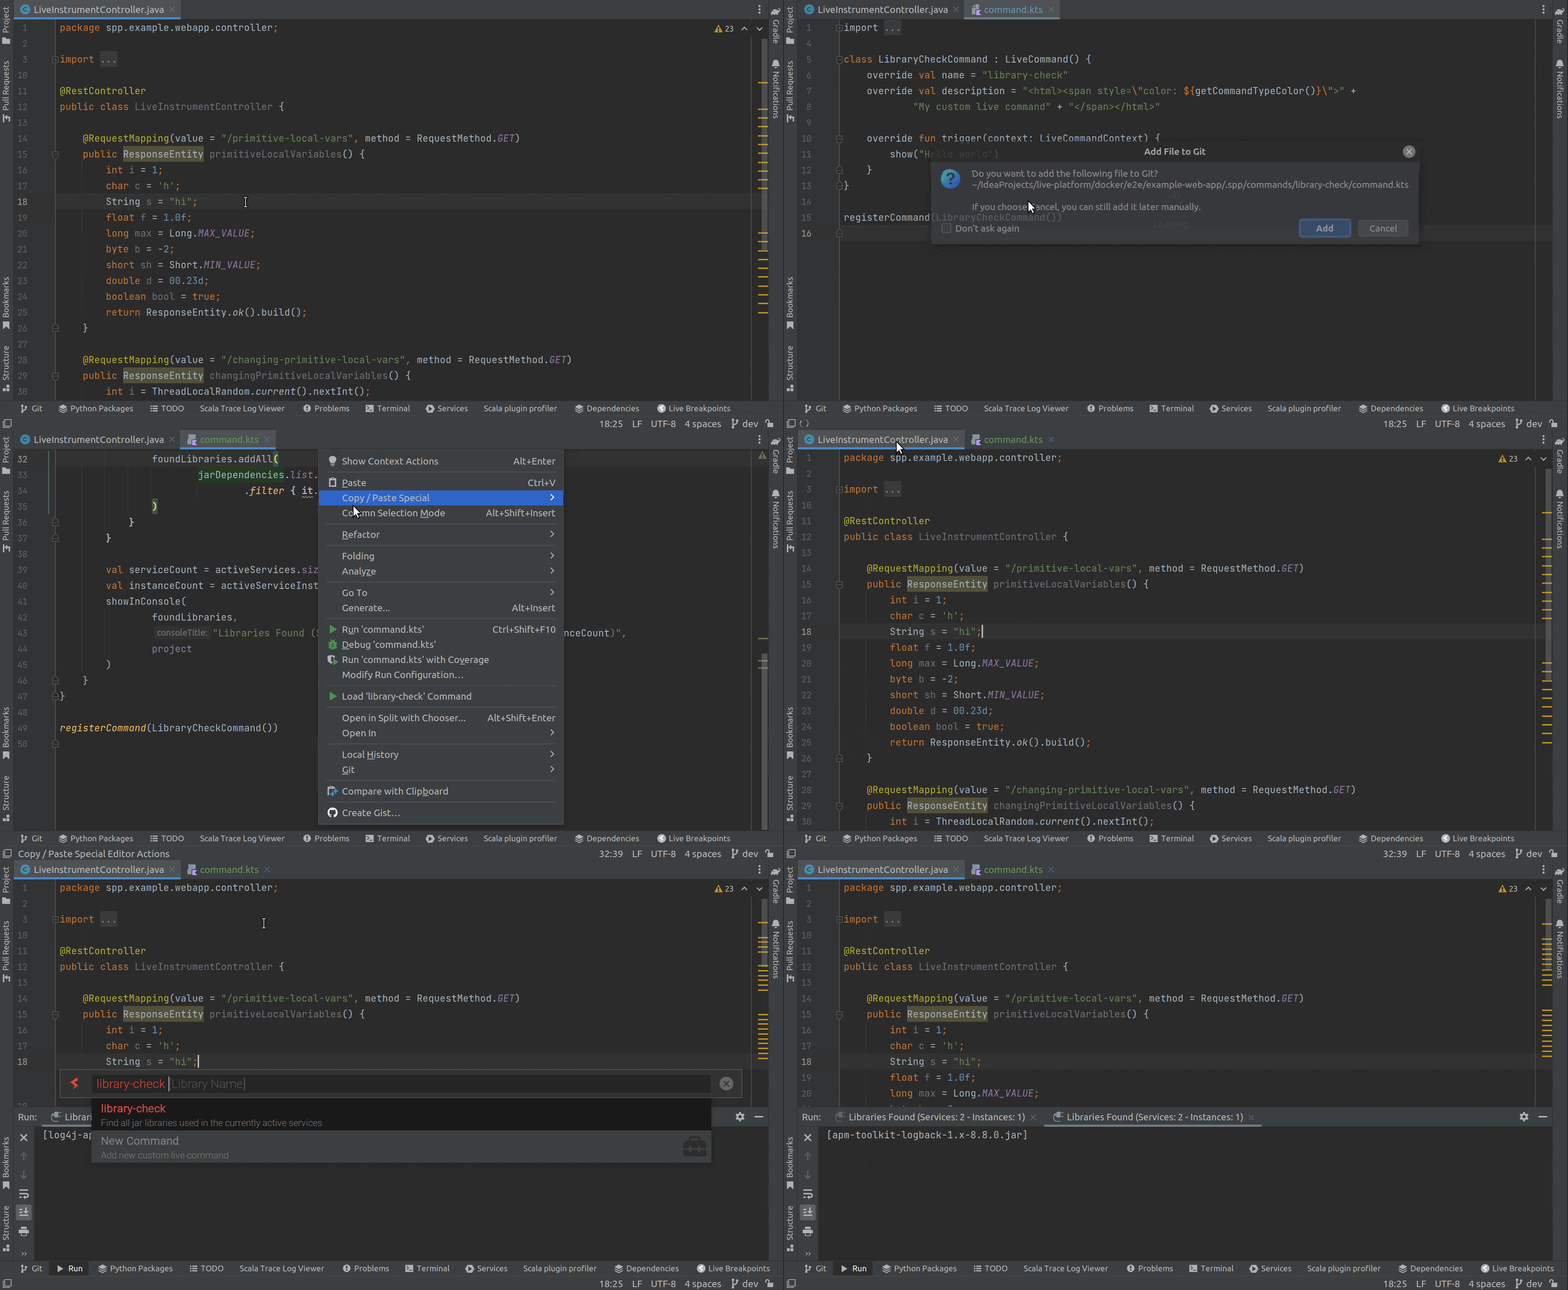
The boot-time command is pretty useful, but let’s say we wanted to do something a little more complicated, such as determining which version of Log4J our application is currently using in production. Of course, we could look through our local set up, but there are many reasons why our local build might be slightly different from production. To be safe, we should check as close to production as possible, but this leads us down the same roads as before with checking logs and/or other external sources. Instead, we can solve this problem (and similar problems) once and for all, for ourselves and our entire team, with another Live Command.
Just as before, we will create a new Live Command, but this time we’ll call it library-check. And similar to the boot-time command, we’re interested in attributes available to us through SkywalkingMonitorService. This time however, we’re interested in Jar Dependencies. This is another attribute the SkyWalking agent exposes, and we can use it to determine the exact dependencies our application is currently using in production. Let’s write a bit of code to do so:
Again, putting this all together, we now have a simple way of determining which versions of libraries our application is using in production. Now let’s make sure we’re not using a vulnerable version of Log4J!
 Dynamically checking Log4J and Apache SkyWalking dependency versions
watch-variable
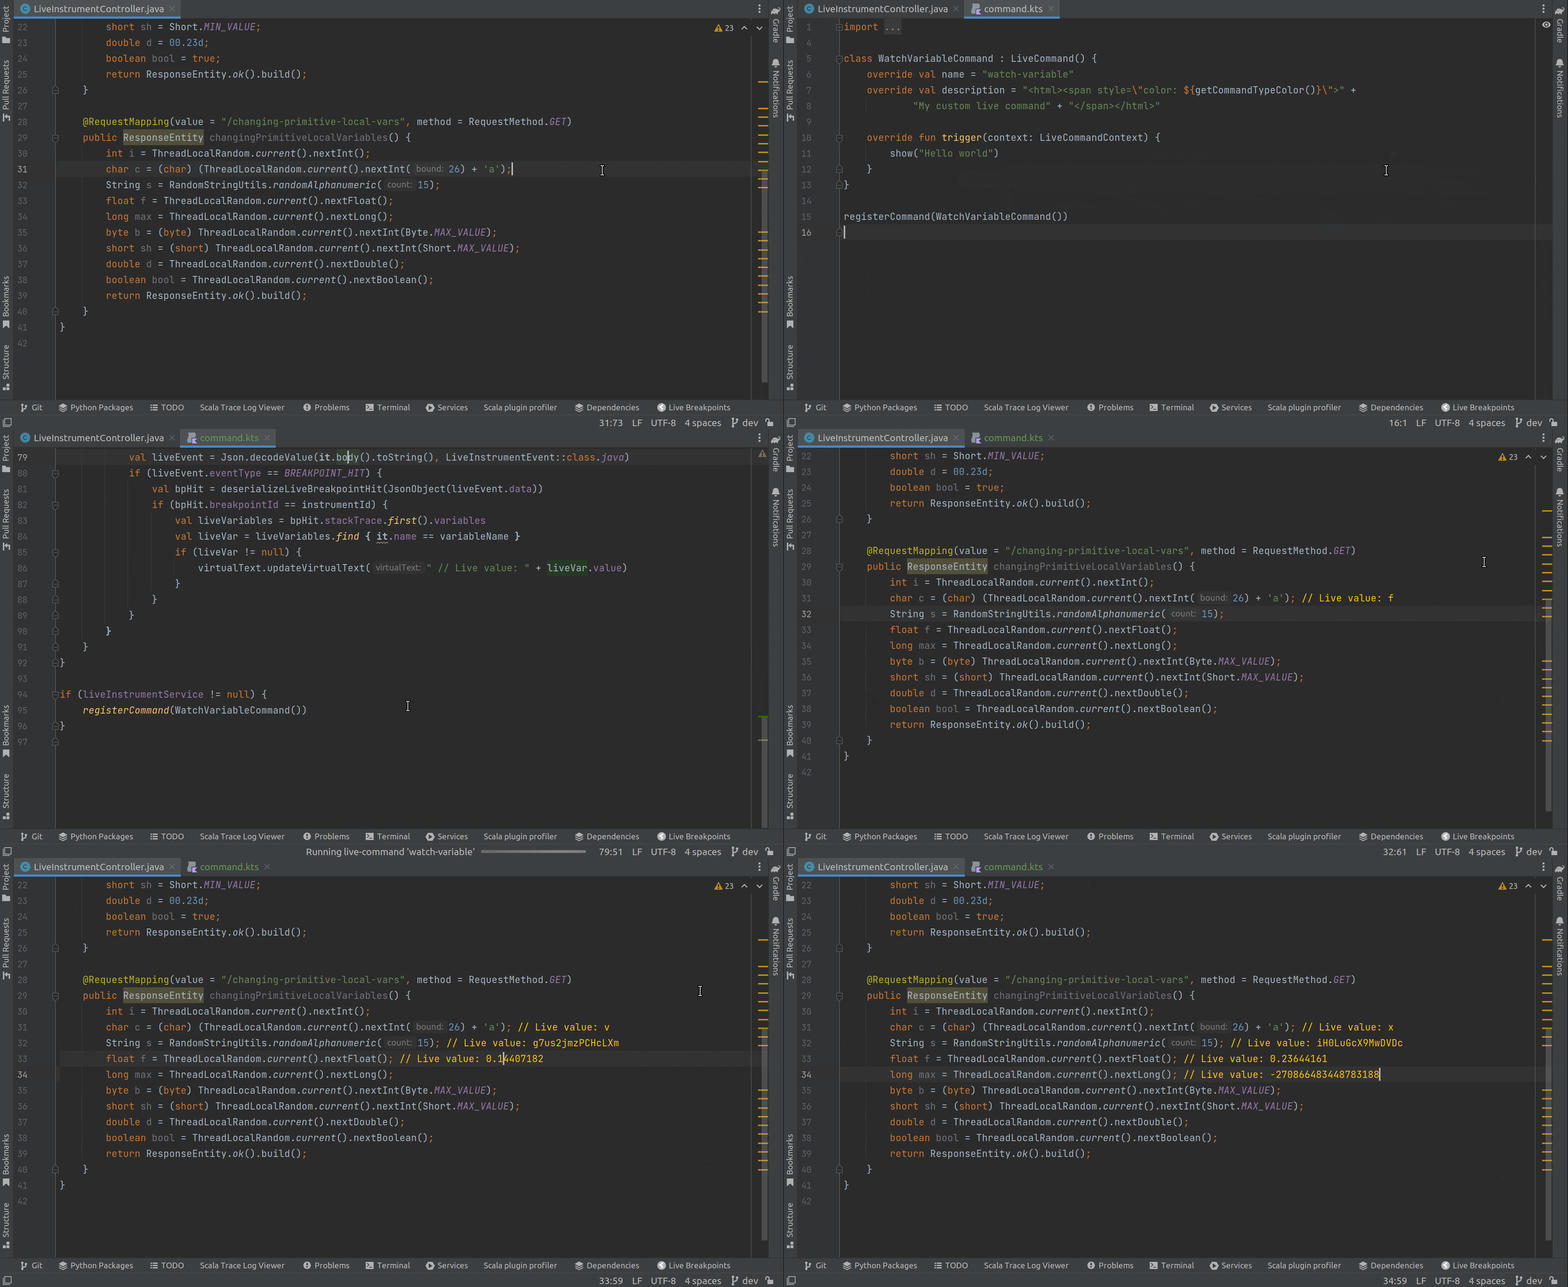
Finally, let’s try something really cool. For our last command, we will create a Live Command that allows us to watch the real-time value changes of any given variable in production! We can safely accomplish this with the use of something we call Live Breakpoints (a.k.a non-breaking breakpoints).
We introduced Live Breakpoints in a previous post, but essentially all you need to know is that they are a type of Live Instrument that allow developers to debug production applications inside their IDE with zero downtime. They are specially designed for production and include role-based access control to give administrators peace of mind while allowing developers the maximum freedom to diagnose problems in production. Everyone wins!
Okay, let’s get started. We will call this command watch-variable and instead of using SkywalkingMonitorService we’re going to use LiveInstrumentService. This service allows us to create Live Instruments and is additionally bound to the Source++ account currently logged in our IDE. This is how administrators control access to Live Instruments. For example, they can restrict Live Instruments to certain environments, code locations, variable names, runtime values, and so on. In the event we try to do something we’re not allowed to, we’ll get an error.
This is just a demonstration though, so let’s do whatever we like:
And putting it all together, we now have a command we can call on any variable we have access to and see the real-time value changes of that variable. And to stop watching variables, we simply close the file with watched variables.
 Imagine how easy production debugging could be with a few skillfully placed watch-variable commands
Try it out
The functionality presented here is just a small sample of what can be achieved with Live Commands. Our goal is to make Live Commands so flexible and powerful that they become the preferred way of encoding and executing domain-specific processes within the IDE.
Think of something you do rather systematically that you haven’t automated. Maybe there is a set of keywords you use to make searching through logs easier, or maybe you have a fairly reliable way of diagnosing certain runtime issues in production. These are perfect candidates for Live Commands as opposed to some partially (or fully) undocumented process future developers have to figure out for themselves. Instead, give those developers the ability to use and evolve the exact processes that have been painstakingly perfected over the life of the project.
We encourage everyone to give Source++ a try. We hope you will take these ideas and run with them. If you have any questions, please feel free to let us know. And as always, happy coding!
